
See where clicks come from, and on which device.
Every tracked click, scan and open lands on one Analytics page. Filter by tag, domain or date, compare periods, and export the rows when you need them somewhere else.
Try Reqlick free for 14 days. No credit card required.


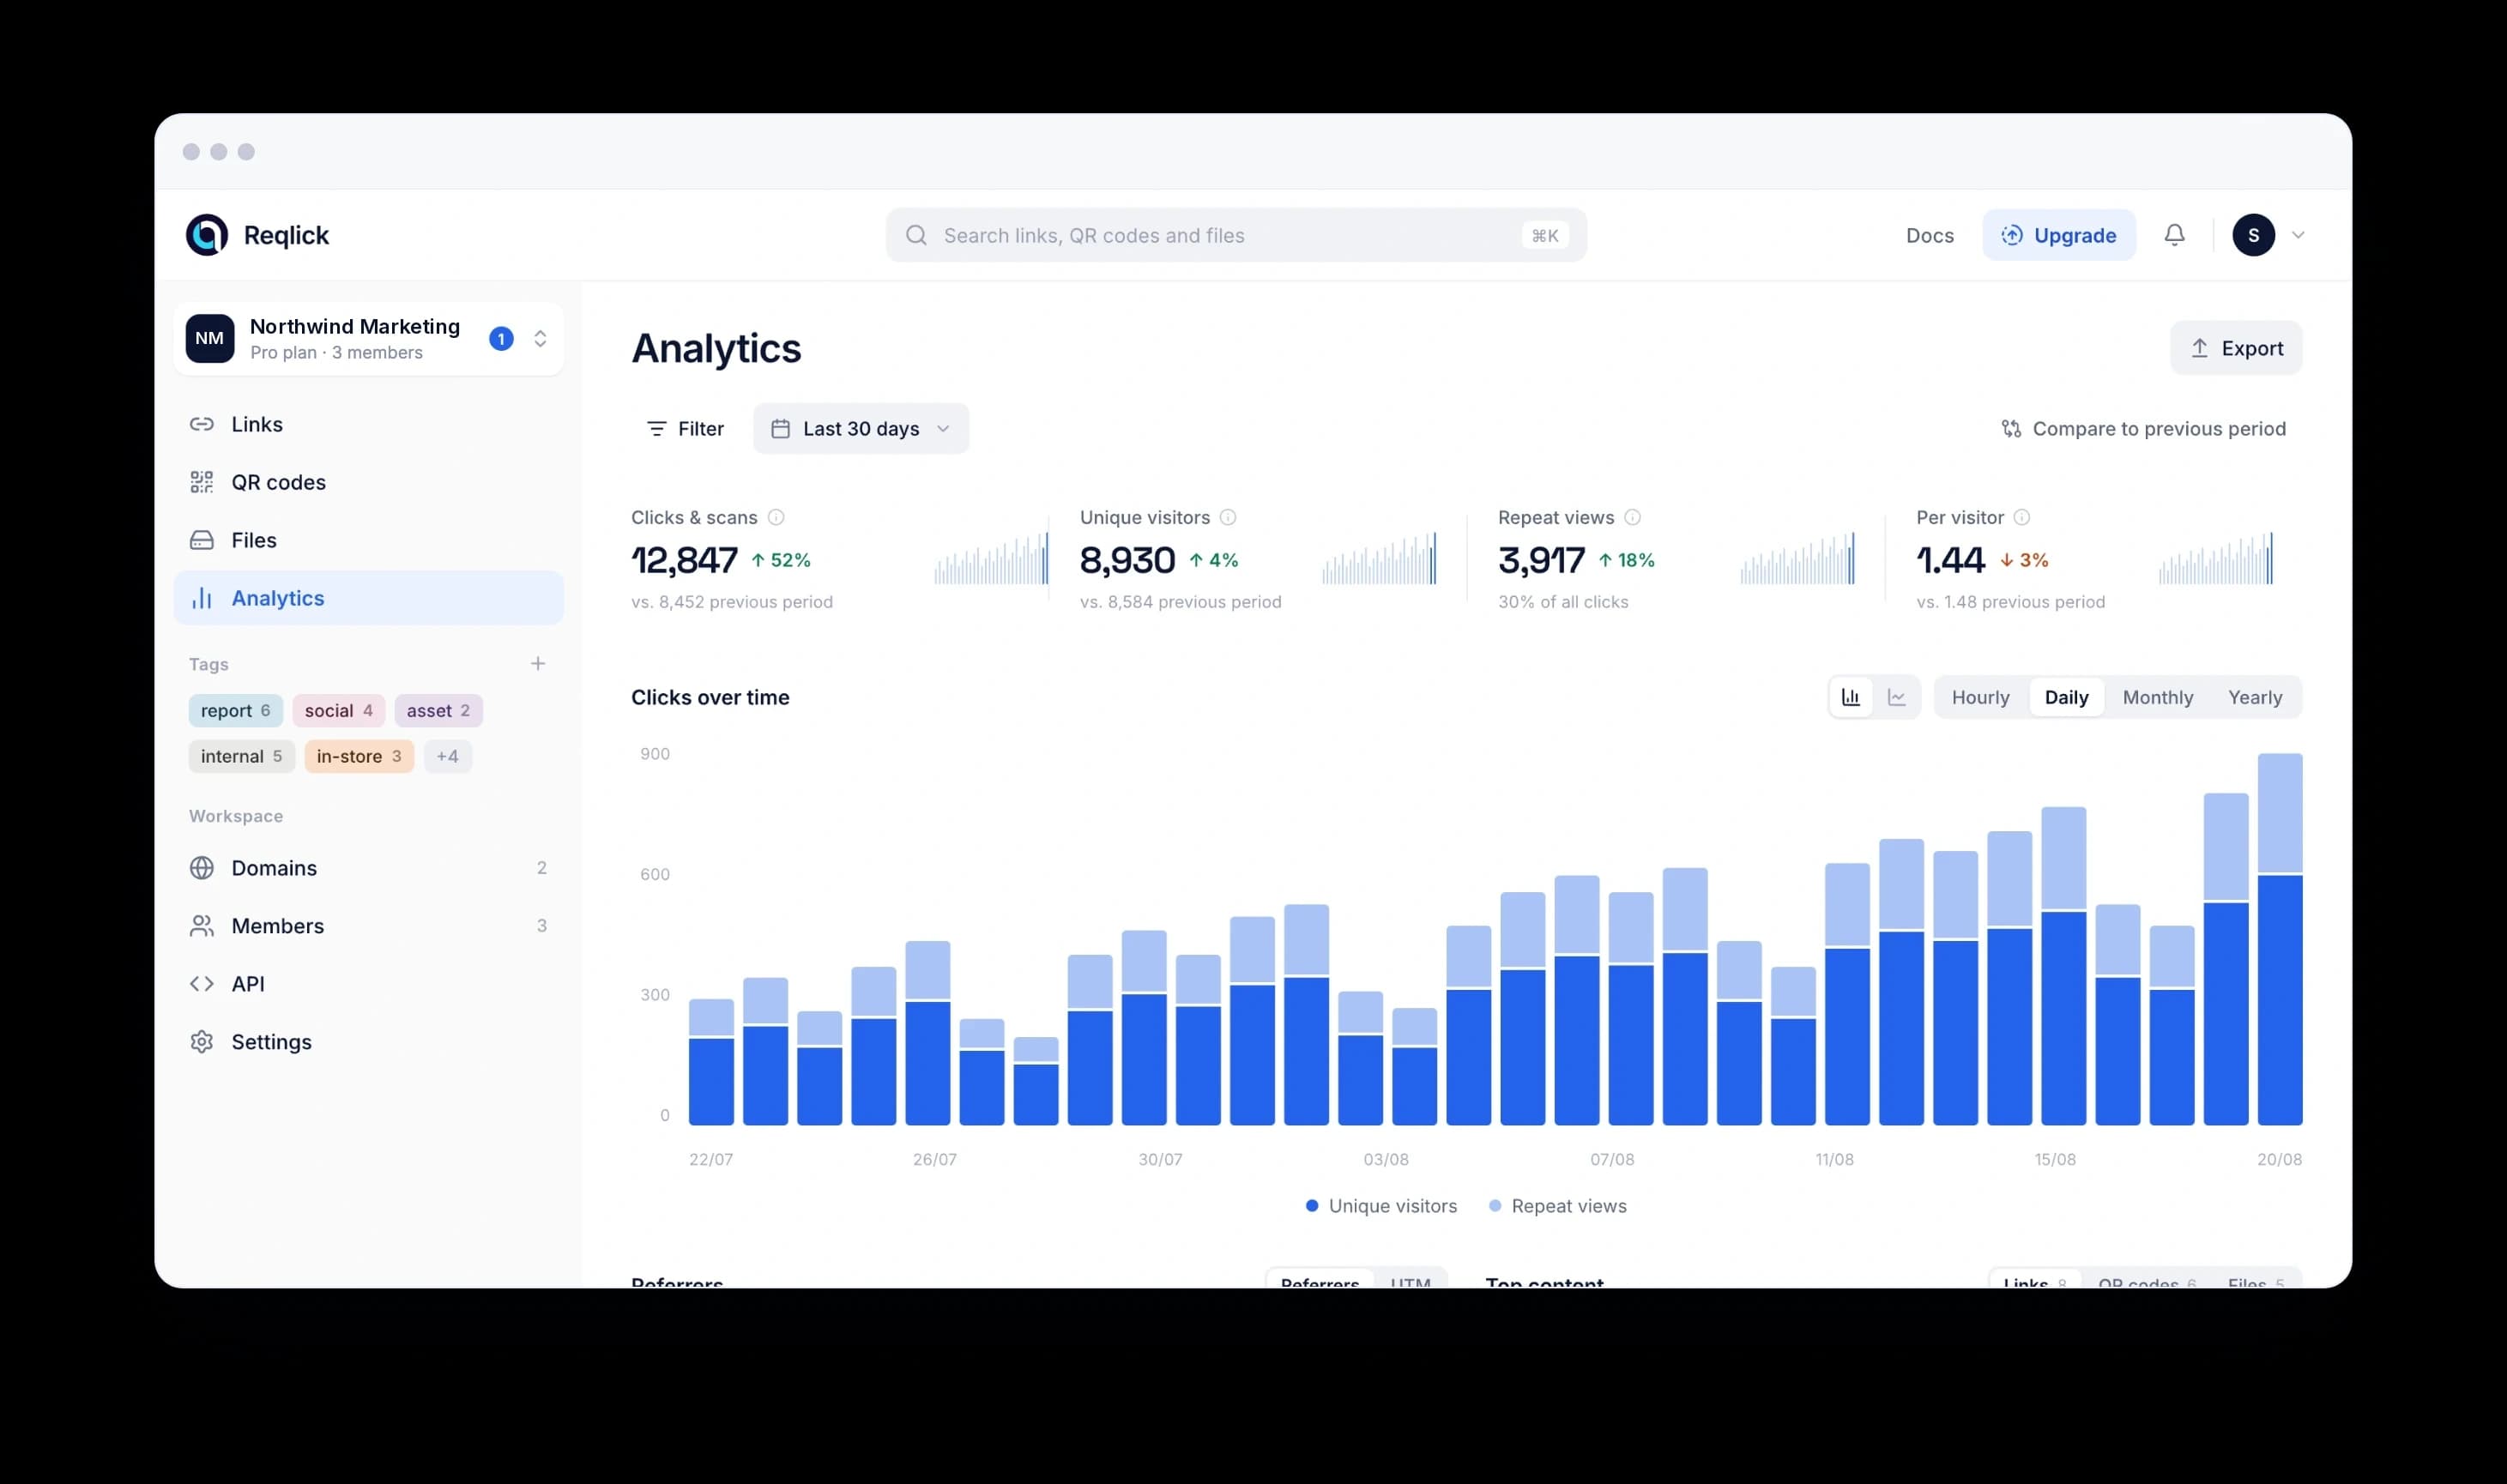
Last 30 days at a glance
Top cities: Paris, London, São Paulo61% mobileInstagram sends 42%Last 30 daysAnalytics at a glance
Tracked clickswith country, city and device
Browser and referrer too. Visits from known bots are filtered out.
5 yearsof history on Business
90 days on Starter and 1 year on Pro. Redirects keep working either way.
About a minutefrom click to chart
A new click reaches the Analytics page within about 60 seconds.
CSVexport of any view
Exports follow your filters. Several views arrive as one Excel file.
What you can see
Clicks over time, referrers, locations and devices. On one page.
Links, QR codes and files report to the same charts, so a campaign that used all three still reads as one campaign.
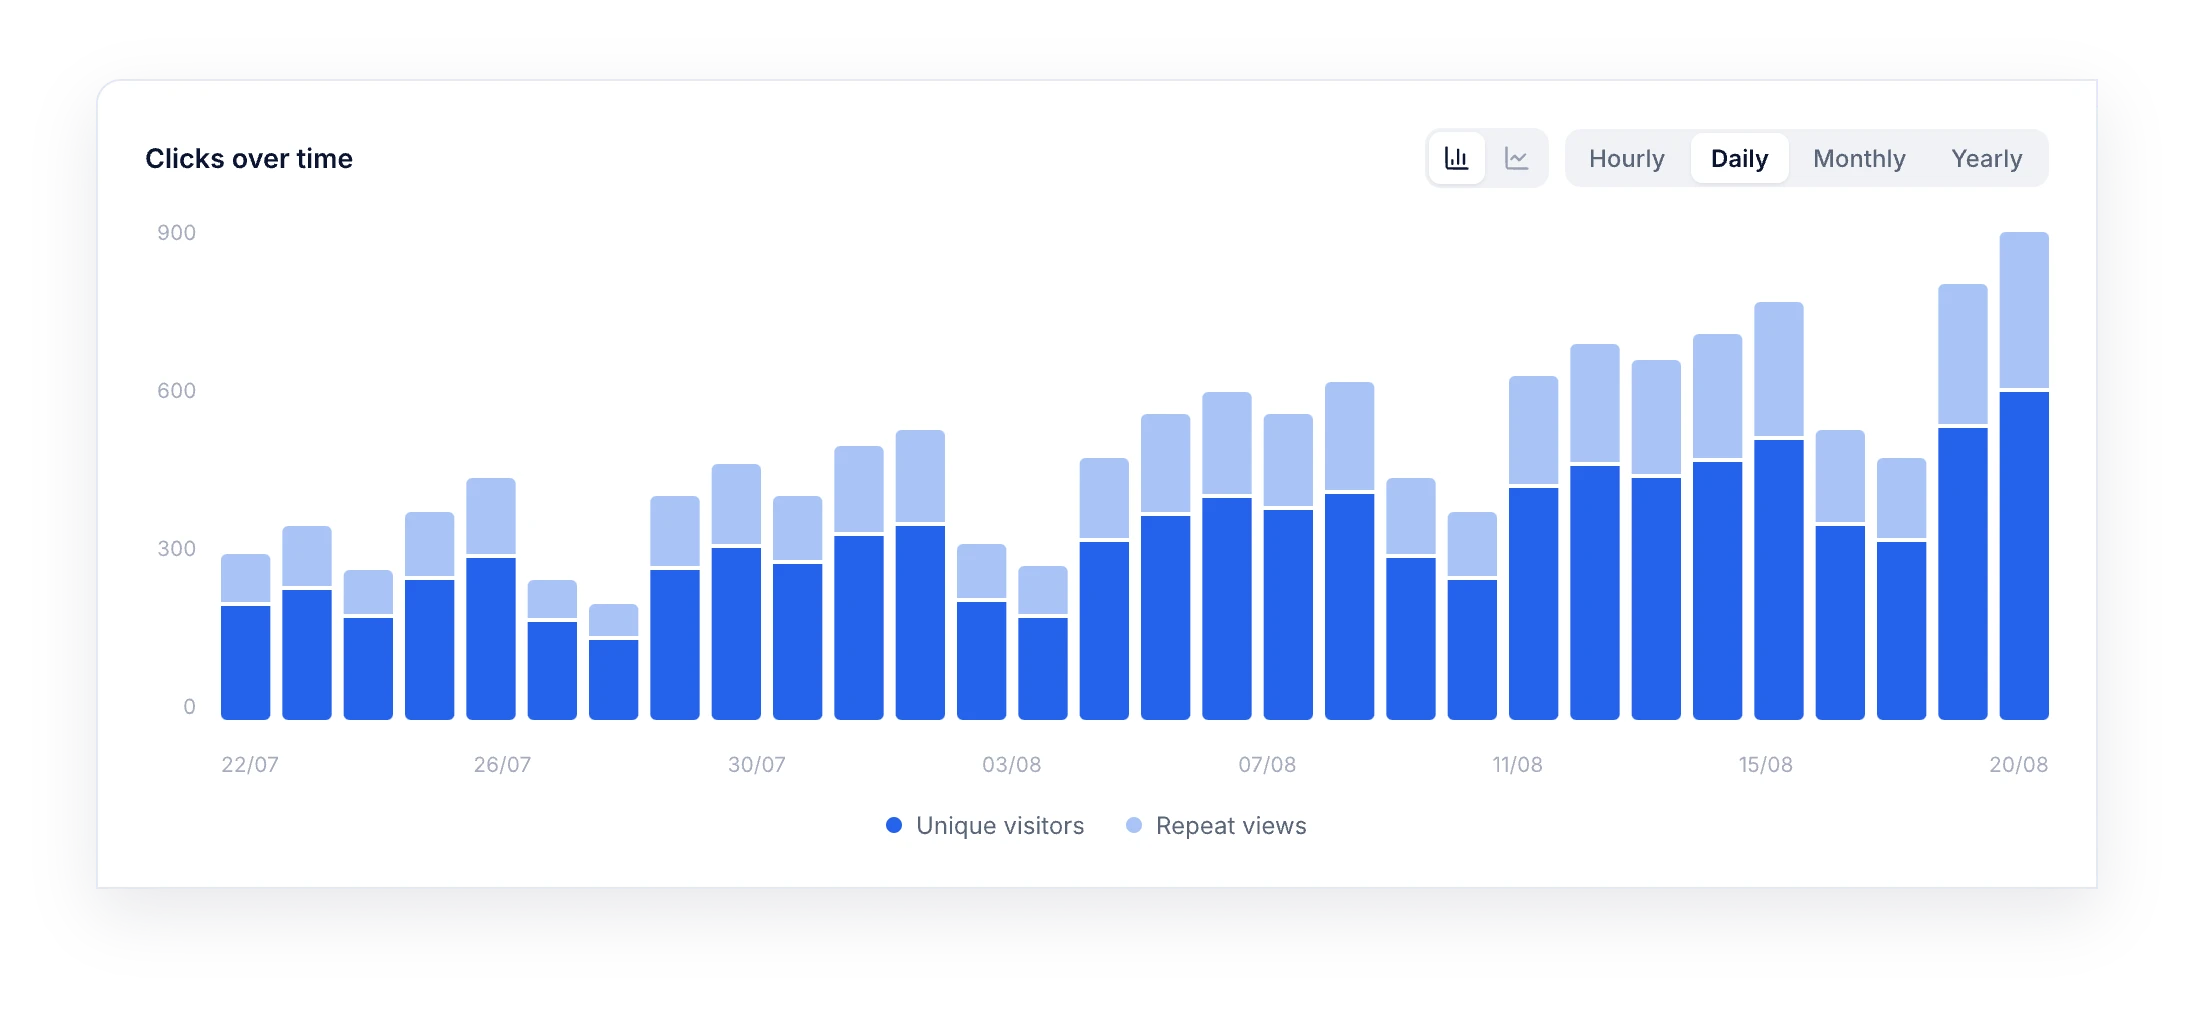
Clicks over time
Hourly, daily, monthly or yearly.
Unique visitors and repeat views stacked on one chart, with each total compared to the previous period. Switch between bars and a line in one click.
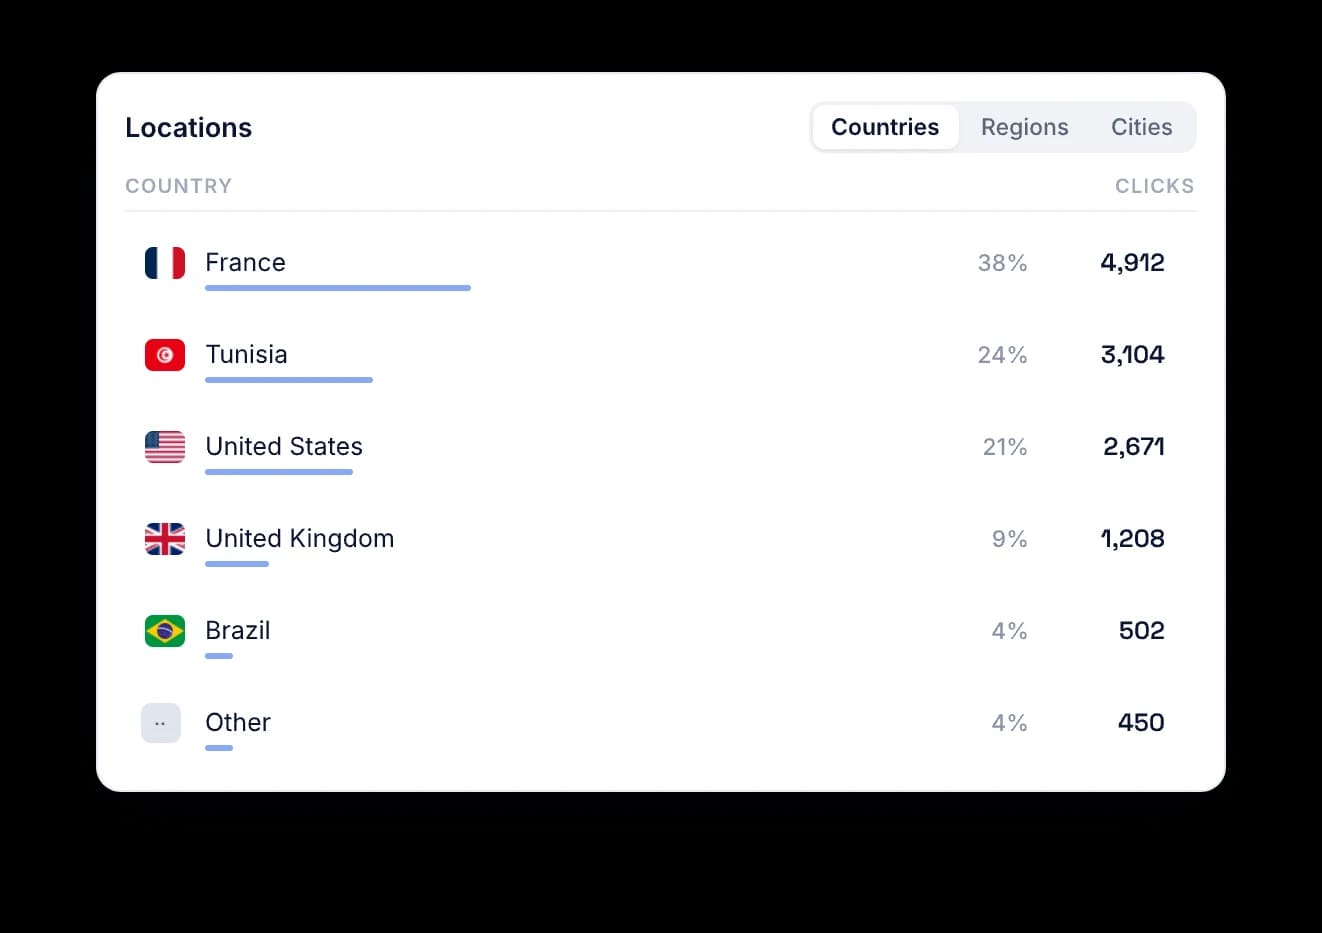
Locations
Country by country, with the share of clicks.
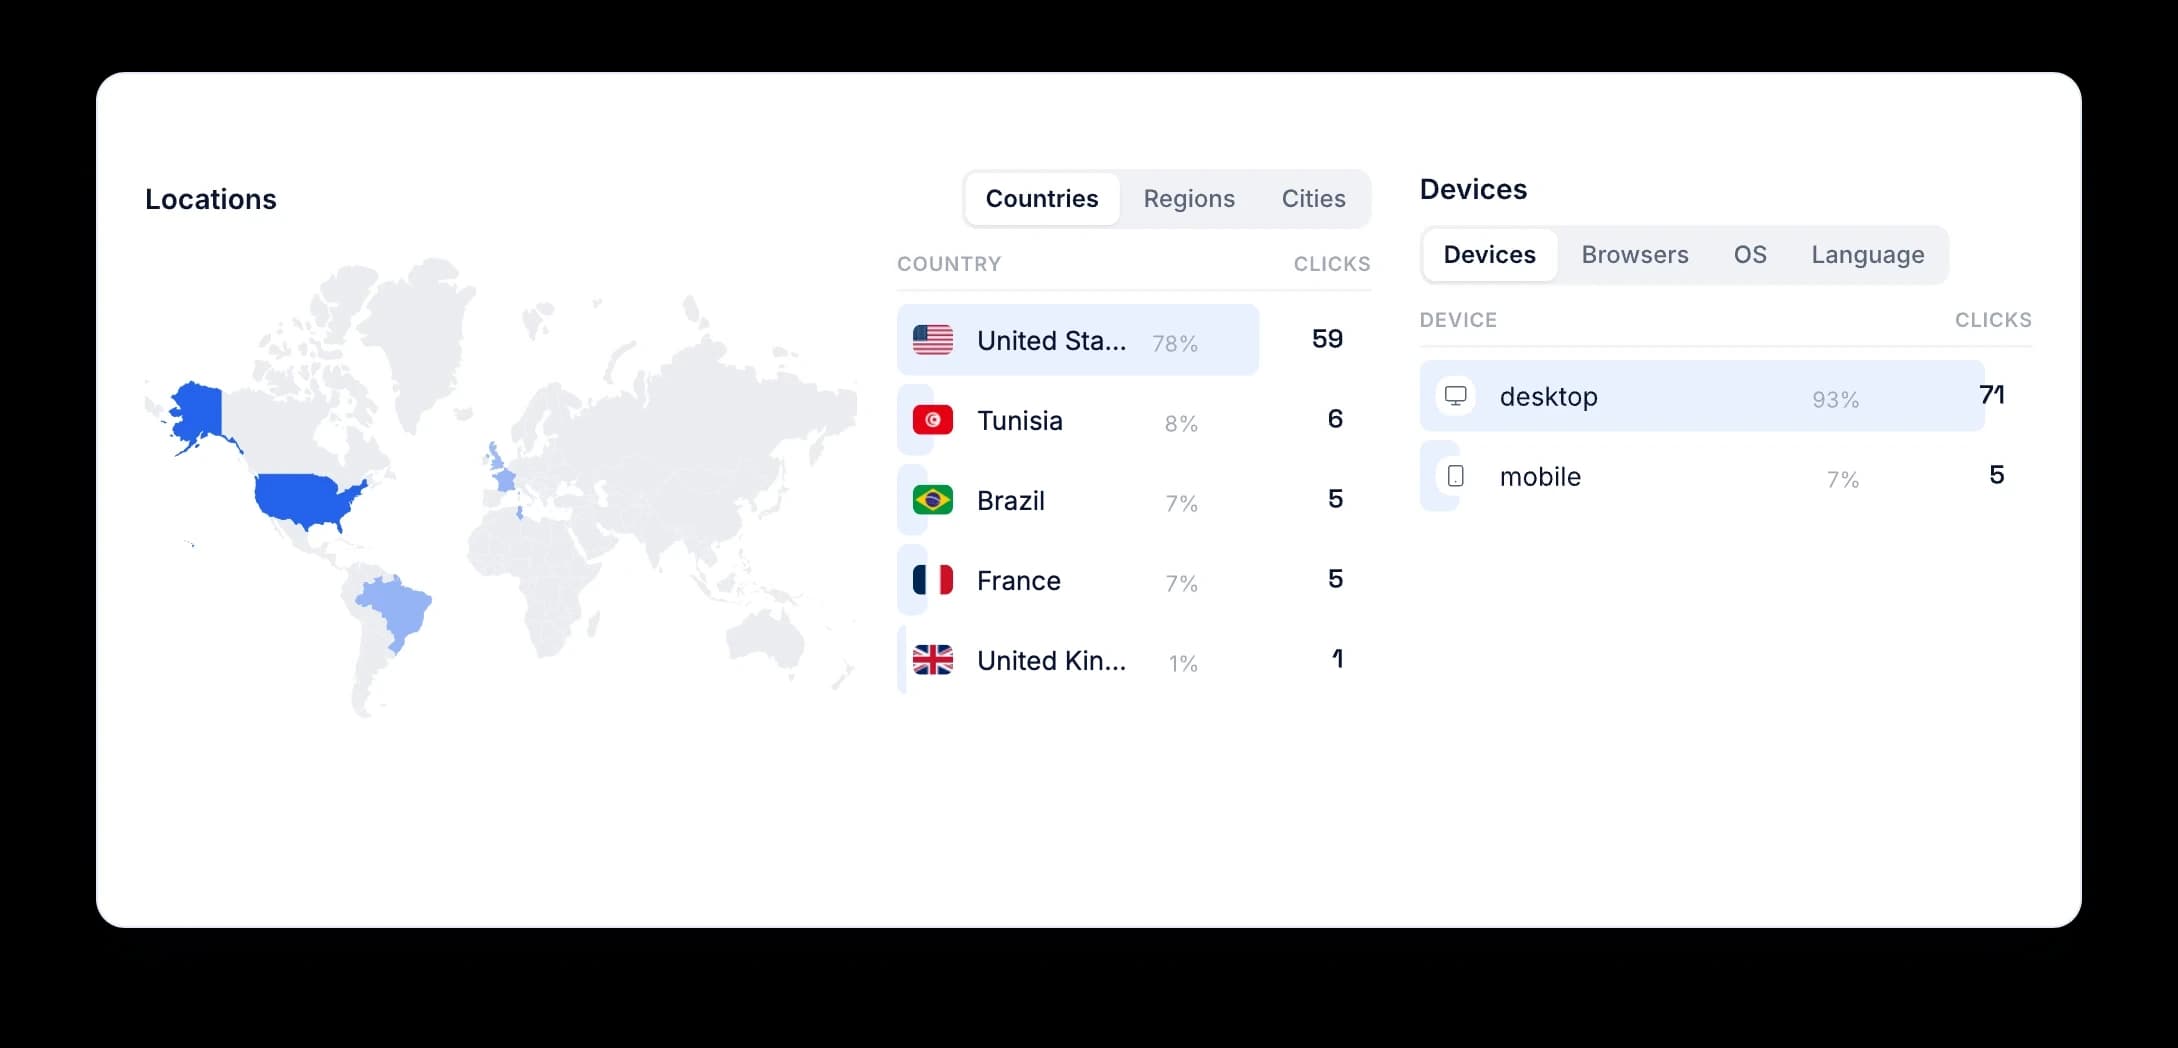
Each tracked click carries the visitor's country and city. Top countries are listed with their share and count.
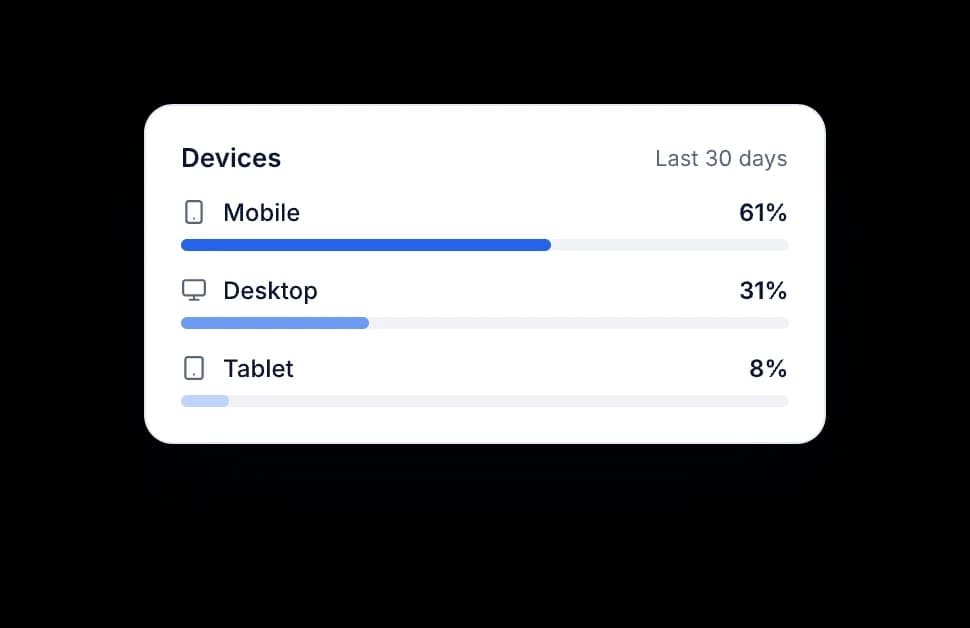
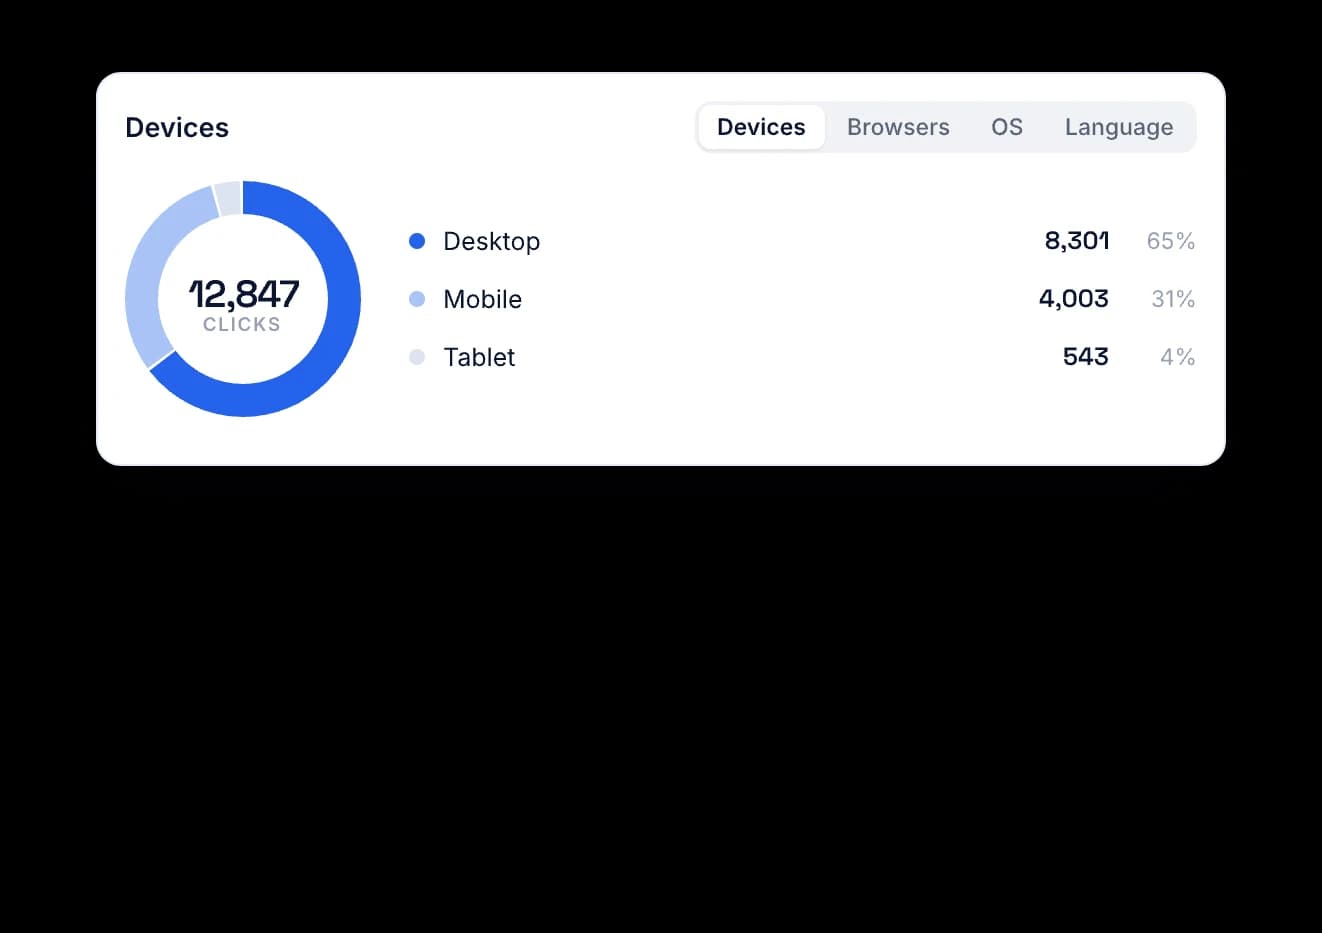
Devices
Mobile, desktop and tablet at a glance.
A share of clicks per device type. Switch the same view to browser, operating system or language.
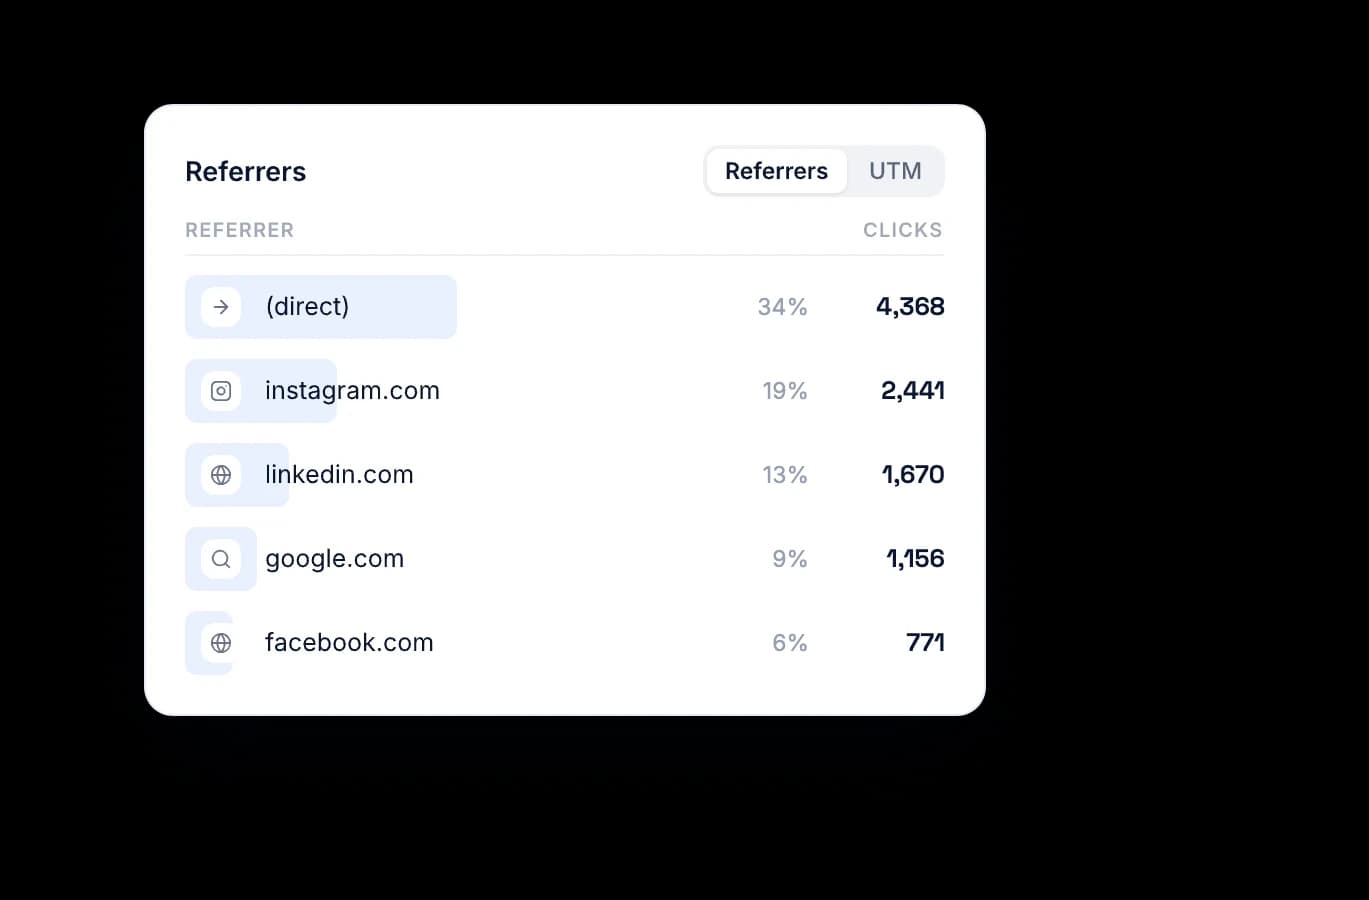
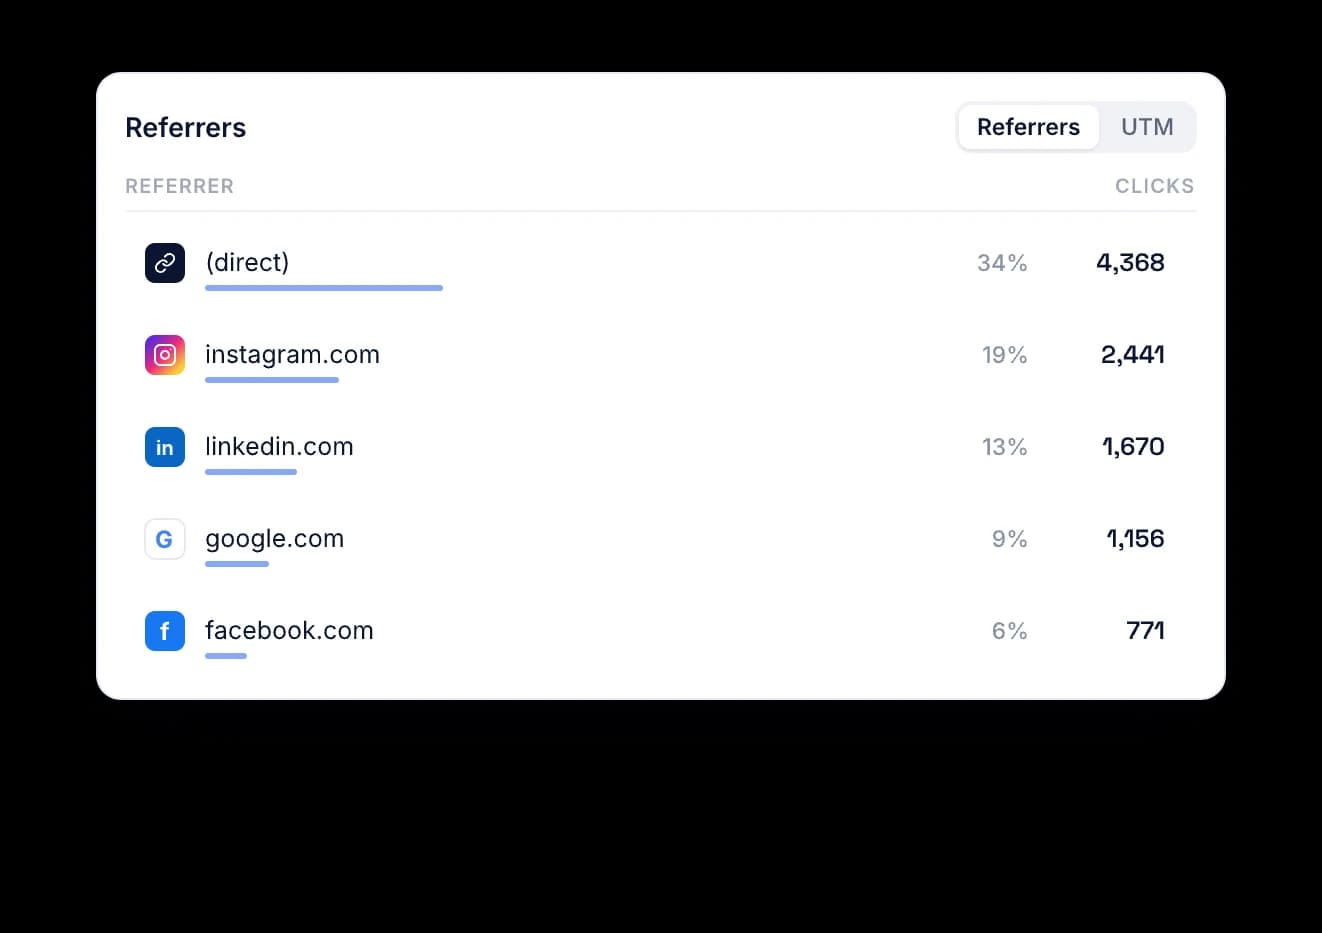
Referrers
Which site or app sent the click.
Direct, social, search and mail, each with its share. Referrers are recorded for links, QR codes and files alike.
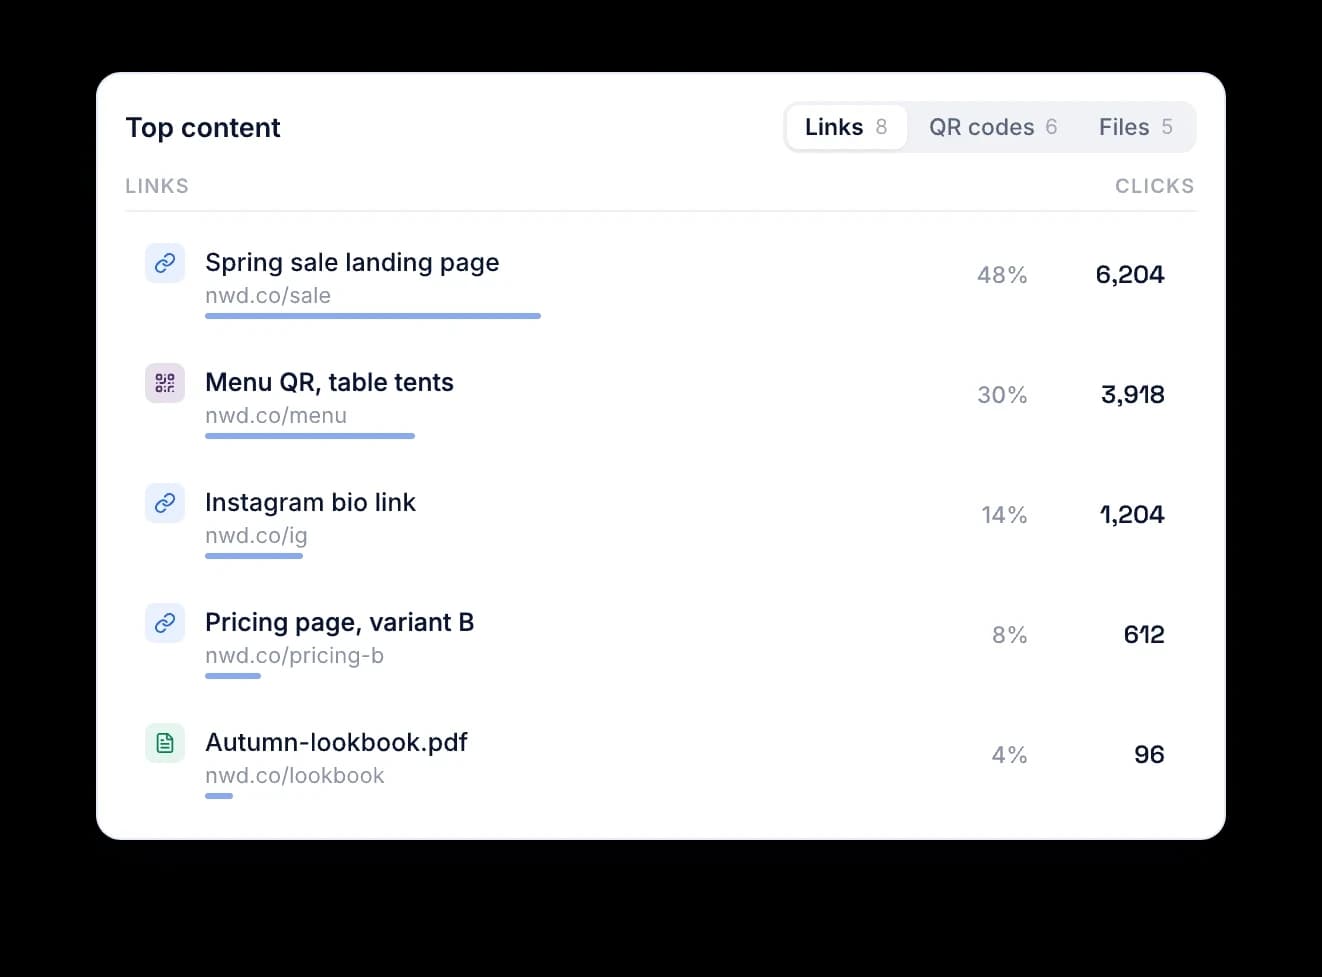
Top content
The links, codes and files that earned the clicks.
Sorted by clicks with the short link under each name. Click a row to filter the whole page to it.
Drill down
Countries, regions and cities. Devices, browsers, OS and language.
Each breakdown has tabs for the next level of detail: countries, regions and cities, or devices, browsers, operating systems and languages. Click any row to filter the whole page to it.
Filter, compare, export
Narrow it down, compare the period, take the rows with you.
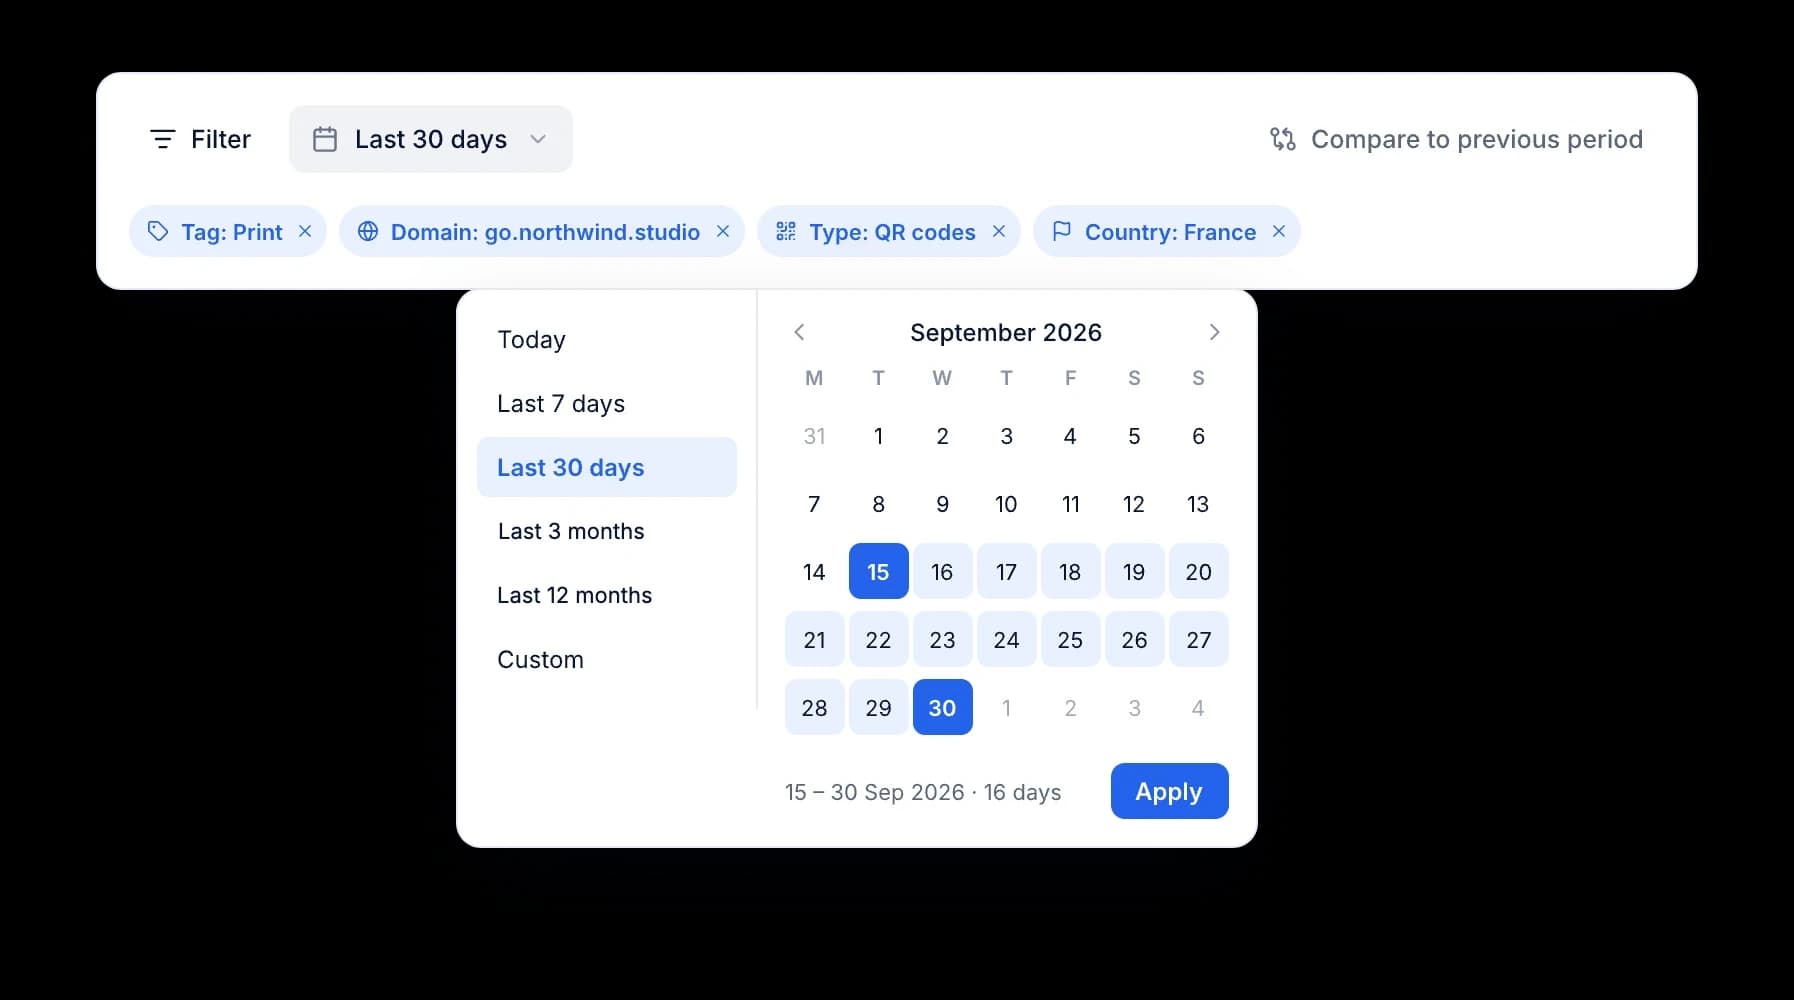
Filter by tag, domain, type or country. Pick a date range or a preset, see each total against the previous period, and export the view as CSV.
Filters and date range
Any combination, kept in the URL.
Stack filters by link, tag, domain, country, device or referrer, then pick the dates. Filters live in the page address, so a bookmark reopens the same view.
Export
Every view leaves as a CSV.
Pick a view, every click or one of the breakdowns, choose the columns and download. Several views at once arrive as one Excel file, one sheet each.
Built for reporting
The numbers a marketing team is asked for, without a data team.
Every view is filterable and exportable on every paid plan.
Filters
Link, tag, domain, type, country and more. Combine them and keep the URL.
Compare periods
Each total against the previous range, with the change on every metric card.
UTM breakdown
Source, medium, campaign, term and content, each in its own tab.
Export
CSV of any filtered view, or several views as one Excel file.
Per-object pages
Every link and file has its own detail page with its clicks.
Tags
Tag a campaign's links, codes and files, then filter the page by that tag.
API
Read workspace analytics with an API key on any paid plan.
Retention
90 days on Starter, 1 year on Pro, 5 years on Business.
Your questions, answered.
Something else? Ask sales or read the docs.
What does Reqlick analytics record for each tracked click?
Each tracked click records the time, country, region, city, device, browser, operating system and referrer, plus the visitor's language when the browser sends it. Visits from known bots are filtered out. Link clicks, QR code scans and file opens are counted in the same analytics, so one campaign reads as one set of numbers.
How long does Reqlick keep link click history?
Starter keeps 90 days of click history, Pro keeps 1 year and Business keeps 5 years. Tracked clicks are capped each month at 25K on Starter, 150K on Pro and 1M on Business, and redirects keep working past the cap. If you downgrade, click history is cut to the new plan's window.
Can I filter QR code and link analytics by tag or domain?
Yes. Filter the Analytics page by link, QR code, file, tag, domain and date, then narrow it by country, device, browser, referrer or UTM values. Clicking a row in any breakdown adds it as a filter, and the filters stay in the page URL so a bookmark reopens the same view.
Can I export click analytics to CSV?
Yes, on every paid plan. Export the view you are looking at as a CSV and choose its columns, or export several views at once as one Excel file with a sheet for each. Exports follow the filters and date range set on the page.
Stop guessing which channel worked.
Create short links, QR codes and file links with tracking built in. Try Reqlick free for 14 days.
No credit card required.